Yes, You've made it !
Tell me where shall I rush a FREE copy of Graphina, ASAP! And I promise you’ll love it…
[ mautic type=”form” id=”9″]
Yes, You've made it !
Tell me where shall I rush a FREE copy of Graphina, ASAP! And I promise you’ll love it…
[ mautic type=”form” id=”9″]
Tell me where shall I rush a FREE copy of Graphina, ASAP! And I promise you’ll love it…
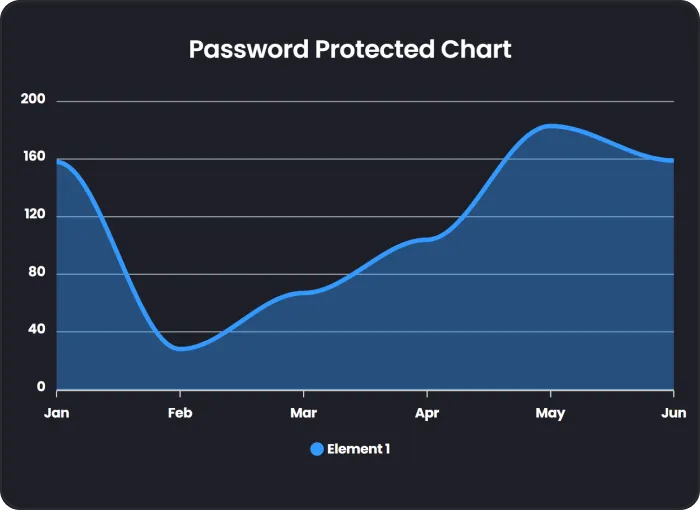
Set up permissions for classified or confidential WordPress graph, charts, data tables, or infographics using view Restrictions.


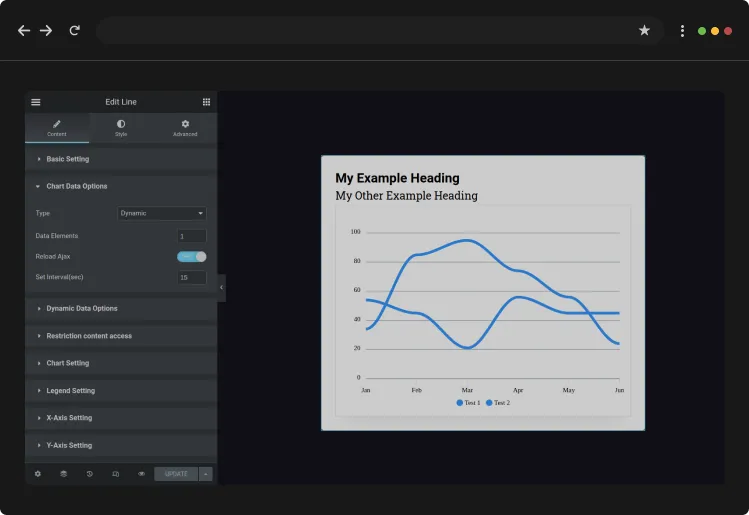
Improve web performance and usability by allowing web users continue viewing with Auto Ajax reloading feature. Reload WordPress graph, charts and data in real-time.
Export dynamically designed WordPress Graph, Charts Datatables data faster and easier to multiple alternatives like PNG, SVG, CSV.
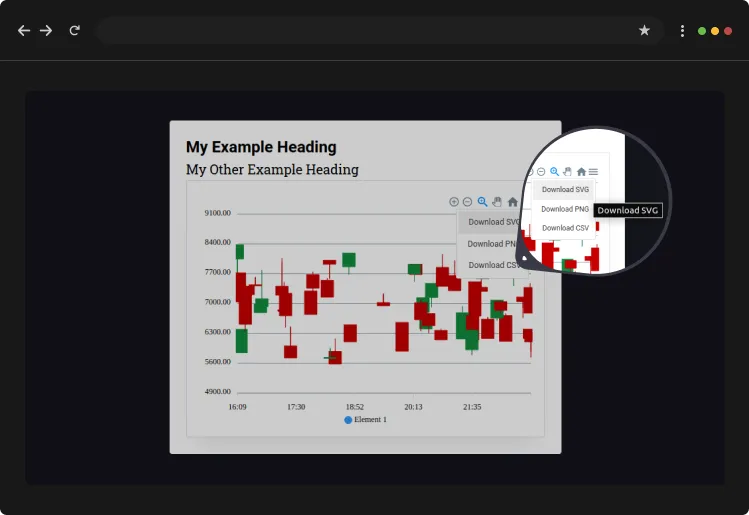
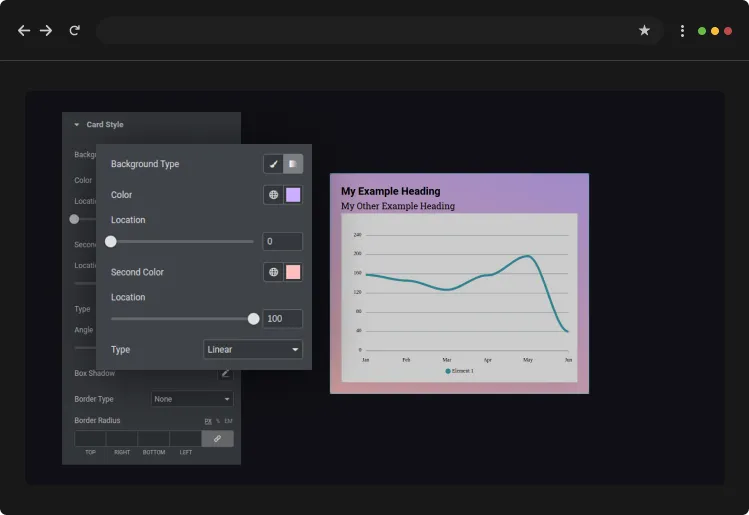
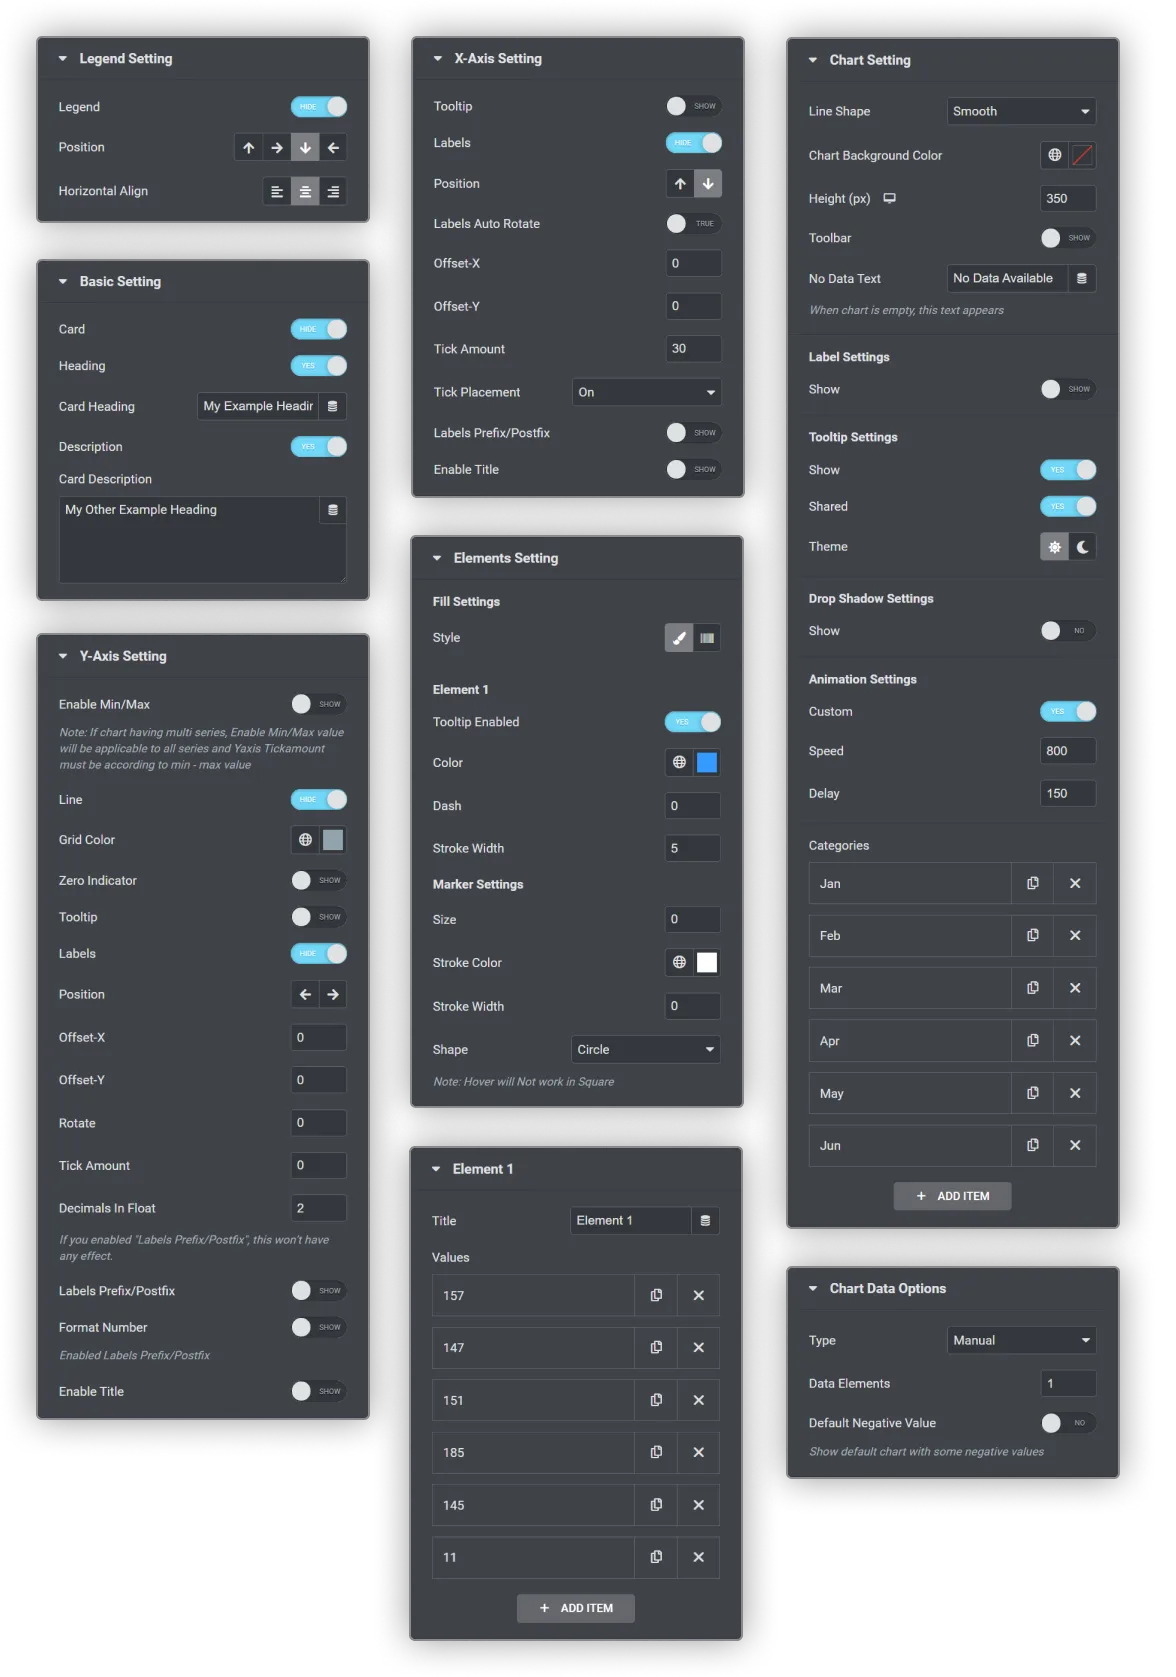
Graphina offers multiple unique options for customizing WordPress graph and charts cards just the way you like it, give it a shot!
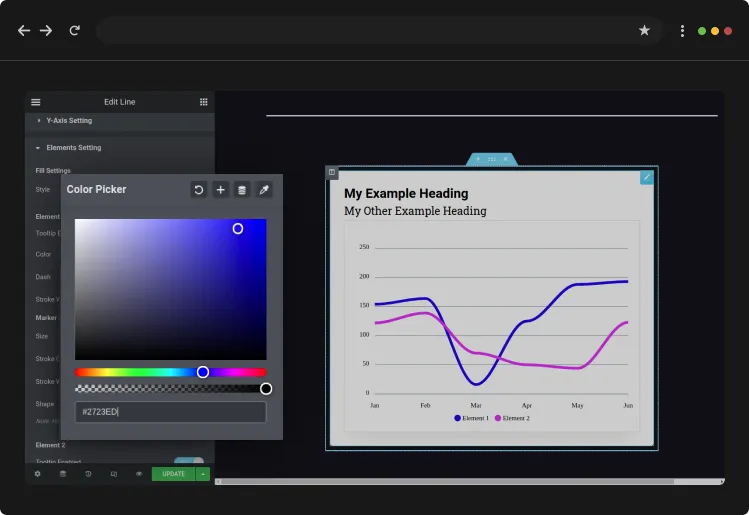
Manifesting a tool that allows customizing WordPress graph and charts your way? We heard you – Graphina – Elementor Dynamic Charts Graphs and Datatables can custom-make the charts and fill it with the eye-pleasing colors just as you want.
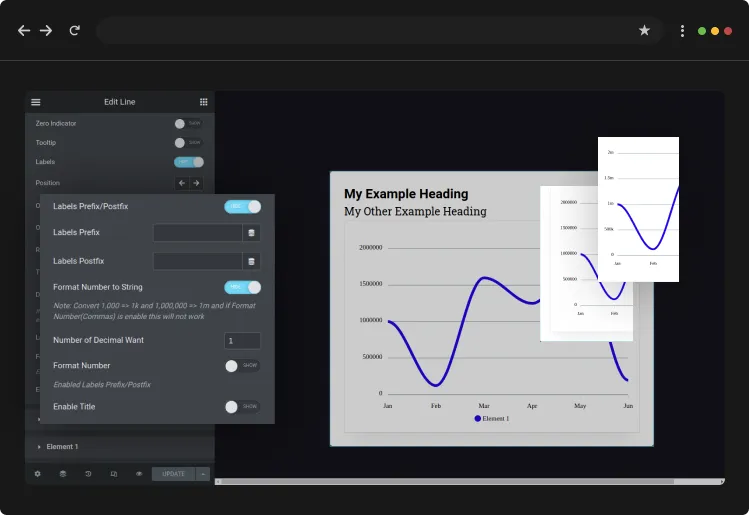
Set your own number format in the WordPress Graph and Charts for localization and offering ease of understanding to your target audience.
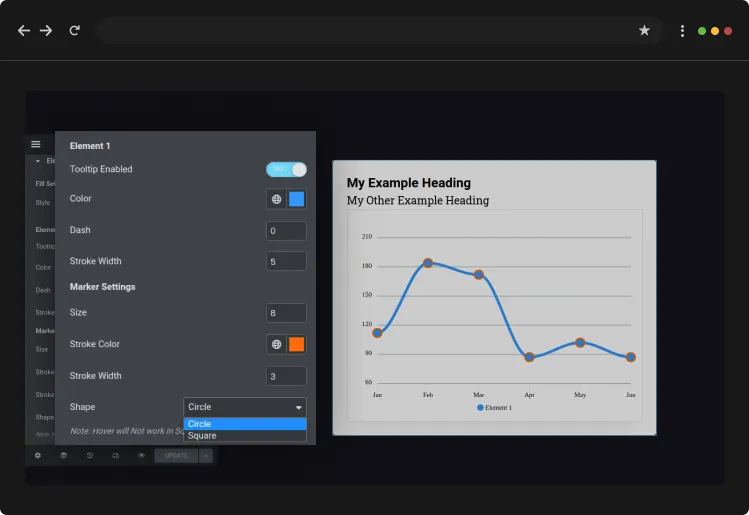
Customize WordPress graph and charts marker style with this best data visualization WordPress plugin of today. Change color, shape, borders, position, number format and more.
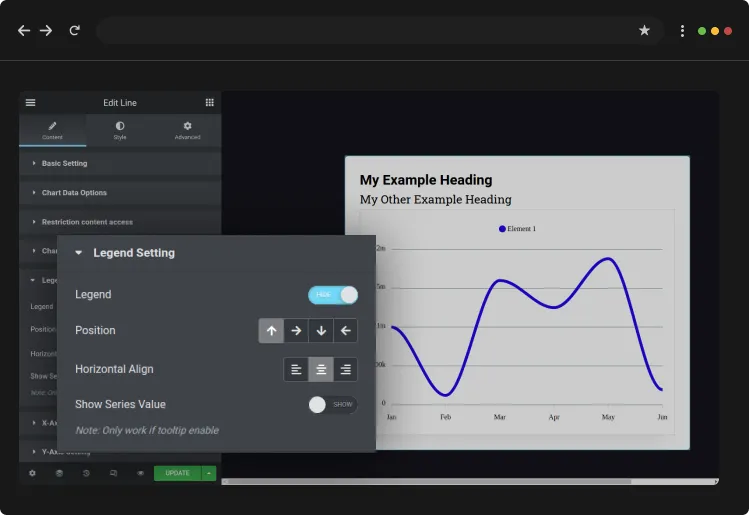
Select from the multiple Legend position options for the WordPress graph, charts, and Tables. Choose from – Top, Bottom, Left, or Right.
Want to display WordPress graph and chart’s X-axis or Y-axis data with a comma for better understanding? Graphina allows you to ,use separator to enhance readability.
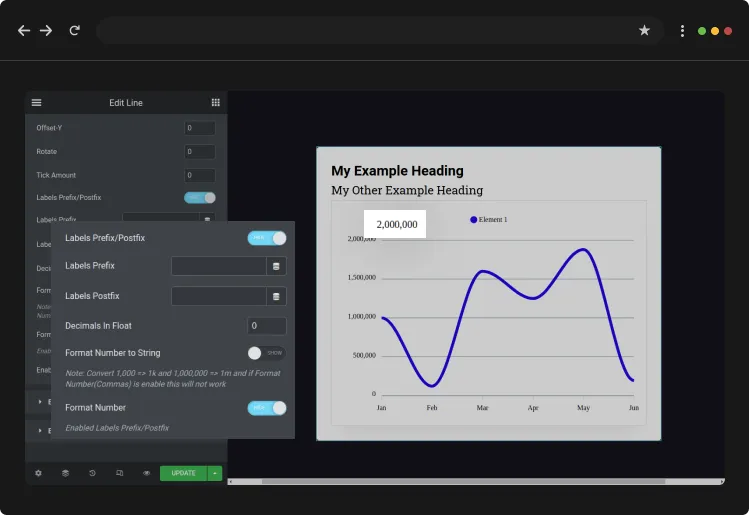
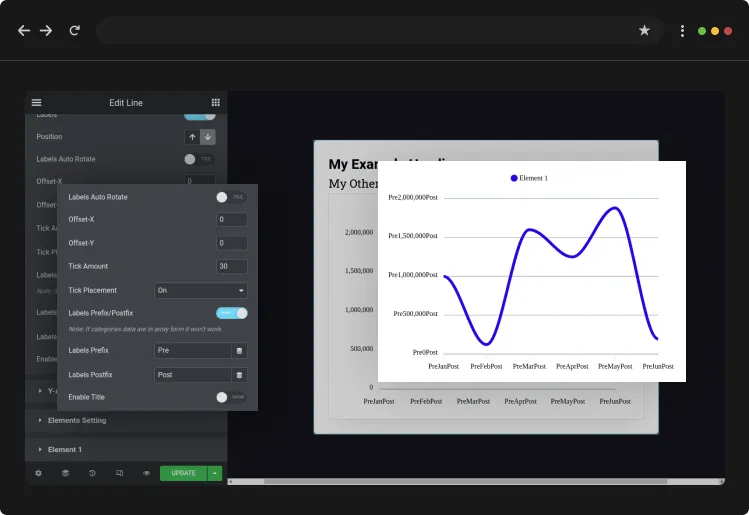
Set prefix and postfix on WordPress graph and chart’s X-axis / Y-axis labels, and data labels with Graphina.
Make the most of data visualization and representation by customizing font style, label positions and rotation, prefix or postfix, and more for your WordPress graph and chart’s XY axis.
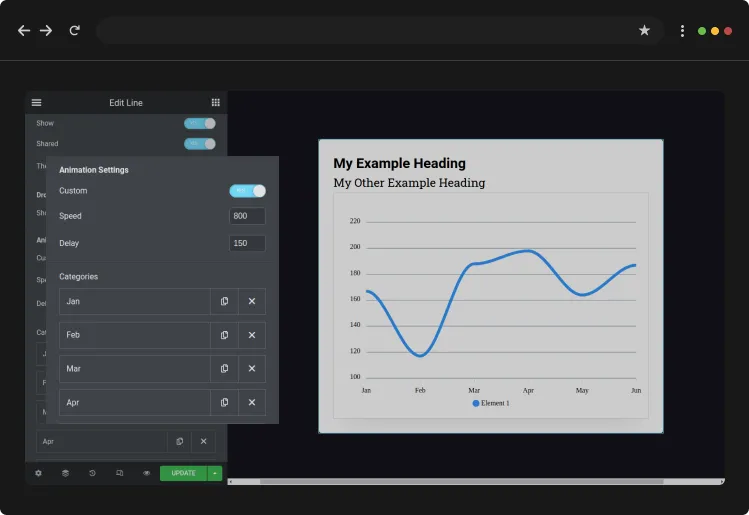
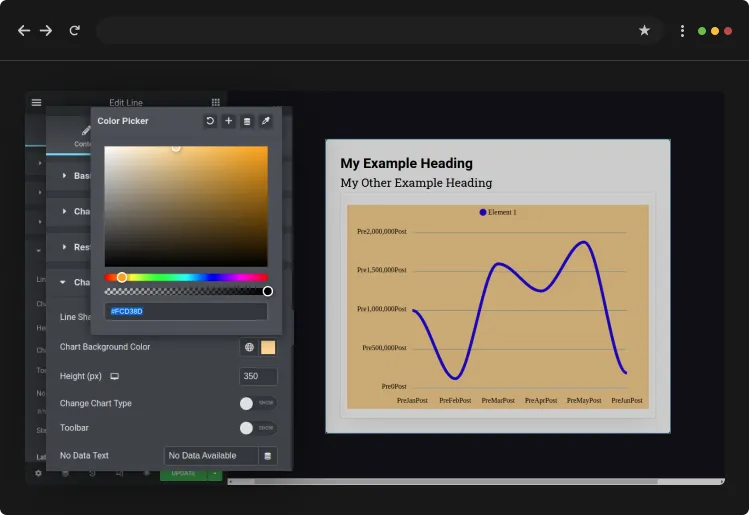
Adopt the most tempting background color palette to your WordPress graph with ton of customizing options right from the Elementor panel.
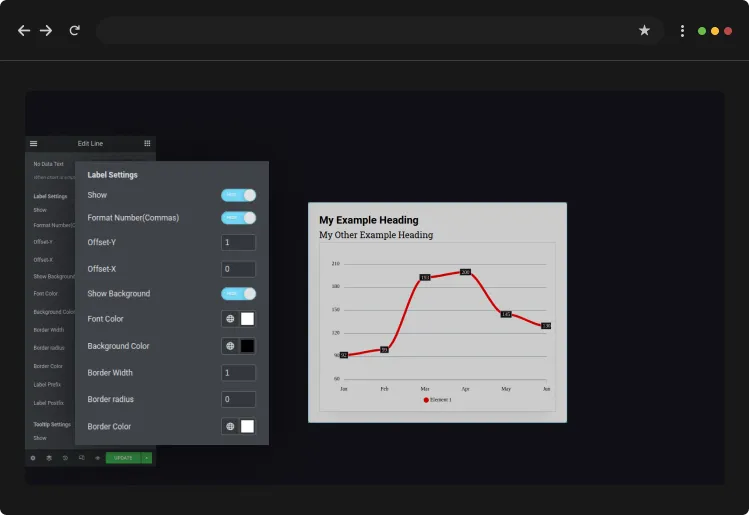
Wear the creative hat and customize WordPress graph, charts data tables. Change background color, borders, position, number format and more with Graphina.
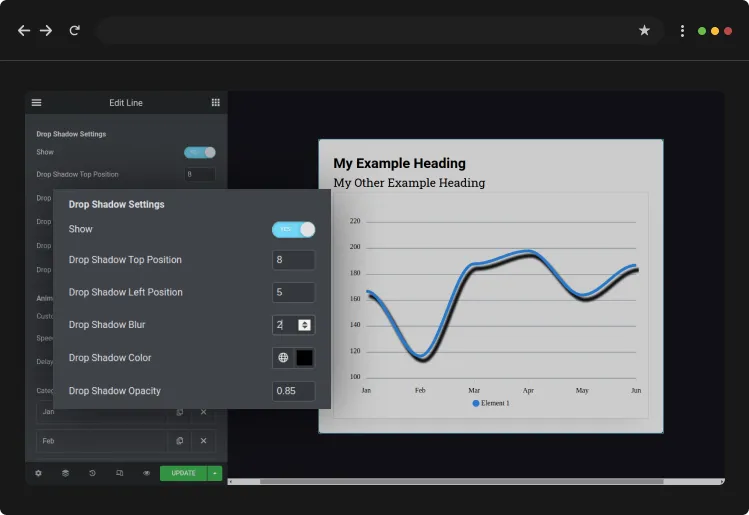
Add depth to your WordPress graph and charts with Shadow settings. Make your dynamic charts more impactful and intuitive with an advanced feature of drop shadow in Graphina.
WordPress Graph, charts and Infographics built with Graphina are downright neighborly, highly customizable & confounding with ultra-smooth animations.


Is your website future-ready? With Graphina dynamic Data visualization WordPress charts and graphs plugin, bring the fully responsive data visualization to the table effortlessly.
Sailing with the cross-browser compatibility of your site, WordPress Graph and charts built with Graphina supports multiple browsers and not only looks flawless but works efficiently on popular browsers.


Deck out the most impact-driven WordPress charts and graphs without any coding or analytics knowledge by following our detailed video guide. Getting started with Graphina is literally in a flash!
Curated this most powerful WordPress graph and charts solution – Graphina with unparalleled attention to details, get ready to experience the easiest way to use data visualization on your website.


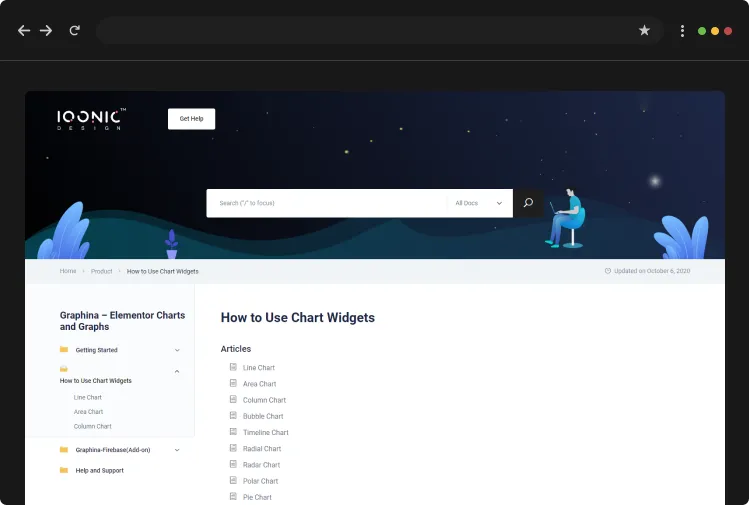
As we know that a detailed documentation is equally important for beginners, Graphina – Elementor Dynamic Charts Graphs and Datatables plugin comes with step-by-step guide.
Compare the best WordPress Graph tool Free v/s Pro
Price
$0
$49
Elementor support
Custom Colors for Chart
3 Type of chart fill setting (classic, gradient and pattern)
Customize Chart Cards
Interactive Chart with smooth animation
Multiple Legend Positioning
Chart datalabel setting
70+ Data & Style Settings
Responsive Design
XY Axis settings
Marker Style Settings
Chart Drop Shadow Settings
Chart background color
Prefix and postfix in x-axis/yaxis label and in datalabel
Optional Commas separator ( 1000 => 1,000)
Format Number to String ( Convert 1,000 => 1k and 1,000,000)
Export Chart data to PNG, SVG,CSV
Low Memory Usage
Fast Performance
25+ Chart types + Counters + Data tables
Ajax loading
Get data from Google Sheets
Firebase ( Separate ADD-ON )
Local CSV
Remote CSV data Import
External API (with optional Authentication)
SQL builder for DB queries
Password Protect your Charts
Role based chart restriction
User ID based chart restriction
Dynamic change Chart type
Exclusive Scatter chart
Conditional Colors for Counters
User id based data from API and SQL query
external Database (MySQL only)
$0
$49

We are absolutely confident that this high-octane WordPress Graph and charts solution will become your ultimate answer to using data visualization in WordPress. We bet there is no looking back once you set in motion with Graphina Pro. Just in case if it doesn’t click you, then we offer 60 DAYS MONEY BACK GUARANTEE.
No. Graphina WordPress graph and charts plugin is an add-on for Elementor themes so you cannot use it without Elementor page builder.
Of course, you can use the most powerful Elementor Dynamic Charts, Graphs and Datatables plugin with any theme that supports Elementor.
All your existing WordPress charts and graphs remains intact and additionally new PRO options will be enabled for those Elementor charts and graphs.
We have built the comprehensively defined library using Apex charts and D3 js which can be the ultimate answer to Data Visualization WordPress themes.
Yes, we would love to hear from you and we promise to accommodate your preference at our best and at the earliest we can. Please feel free to speak to us at hello@iqonic.design.
